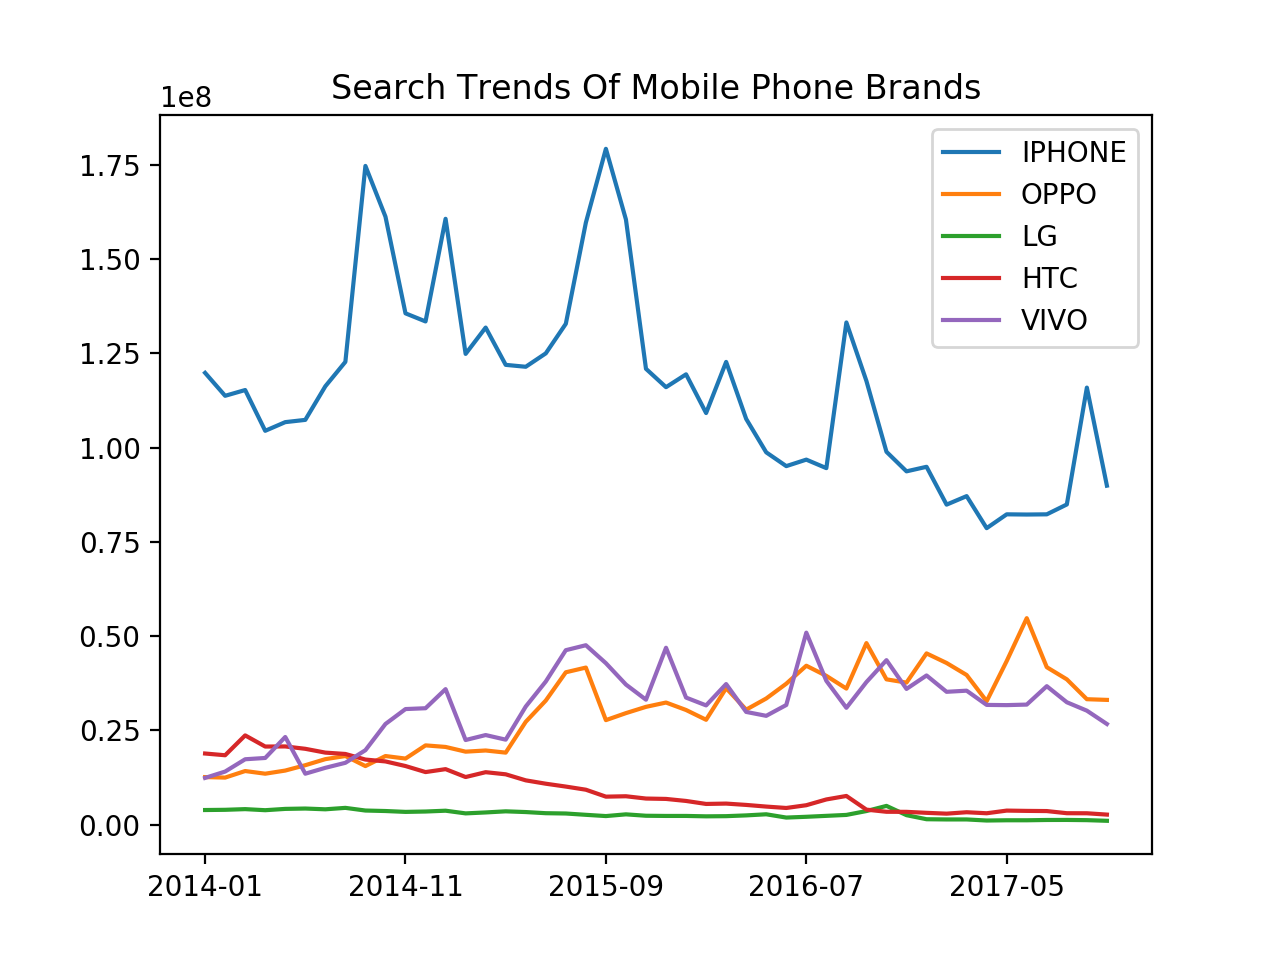
手机品牌搜索走势图
当前,各应用平台每天都在产生海量的数据。基于海量数据的深度分析报告越来越有价值。该领域涵盖数学、统计学,计算机科学等众多学科,是一个值得深入研究的方向。本文涉及的是一个简单的数据分析场景,旨在梳理使用Python数据分析涉及的常用类库(pandas、matplotlib等)与入门知识。本文对指定的几家手机品牌,按日期区间,从百度指数网站获取其月度搜索数据,然后绘制出它们的搜索走势对比图。
1)关键点
a)日期区间(使用pandas的date_range方法);
b)对指定日期(年月),获取手机品牌清单中各品牌的搜索量(requests使用);
c)构造DataFrame(重点关注data、index和columns参数传值),结合matplotlib绘图。
2)Python代码
#!/usr/bin/python3
# -*- coding: UTF-8 -*-
import requests
import pandas as pd
from datetime import datetime
import json
from pandas import DataFrame
from matplotlib import pyplot as plt
def get_indices(year, month, brands):
    uri = 'http://index.baidu.com/Interface/Newwordgraph/getTopBrand?i=2&datetype=m&year=' + year + '&no=' + month
    r = requests.get(uri)
    if 200 == r.status_code:
        brand_indices = {data['name']: data['value'] for data in json.loads(r.text)['data']['data']}
        return [int(brand_indices[brand]) for brand in brands]
    return []
if '__main__' == __name__:
    brands = ['IPHONE', 'OPPO', 'LG', 'HTC', 'VIVO']
    year_months = [datetime.strftime(date, '%Y-%m') for date in
                   pd.date_range(start='20140101', end='20171101', freq='m')]
    data = []
    for year_month in year_months:
        year, month = year_month.split('-')
        indices = get_indices(year, month, brands)
        data.append(indices)
    frame = DataFrame(data, index=year_months, columns=brands)
    frame.plot()
    plt.title('Search Trends Of Mobile Phone Brands')
    plt.show()
3)结果输出
大连
2017年11月28日

版权声明:该博客文章由作者通过「知识共享署名 4.0 许可证」进行授权,转载须注明文章原始链接。
相关文章
评论
 正在加载评论......